#include <ConfusionMatrix.h>
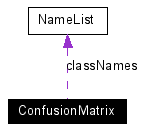
Collaboration diagram for ConfusionMatrix:

Public Member Functions | |
| ConfusionMatrix (NameList *classNames) | |
| Creates an empty confusion matrix object. | |
| void | clear () |
| Clears the confusion matrix, removing any existing data. | |
| int | getSize () |
| Accessor method. | |
| const string & | getClass (int i) |
| Accessor method. | |
| void | addEntry (std::valarray< float > &predictions, int expectedClass) |
| Adds a data sample to the confusion matrix. | |
| float | get (int predictedClass, int expectedClass) |
| Provides direct access to the confusion matrix's raw data. | |
| float | getPredictedTot (int i) |
| Accessor method. | |
| int | getExpectedTot (int i) |
| Accessor method. | |
| float | getPercentCorrect () |
| Accessor method. | |
| int | getEntryCount () |
| Accessor method. | |
| void | pgmGraph (ostream &ost) |
| Generates a portable gray map (.pgm) version of the confusion matrix. | |
| TxtPad * | charPlot () |
| Generates a TxtPad object holding a formatted confusion matrix in tabular form. | |
The table has size L x L, where L is the number of class labels. Such a representation offers class-specific insight into the classification performance of the model used to fill the confusion matrix. In other words, it tells not just the percentage of classes that are classified correctly, but when samples are misclassified, which classes tend to be confused for each other more often. This implementation allows distributed predictions to contribute; in other words, the prediction for a sample does not need to be a discrete class, but can be a probability distribution over the set of class labels.
|
|
Creates an empty confusion matrix object.
|
|
||||||||||||
|
Adds a data sample to the confusion matrix. Since a probability distribution is specified for the prediction, these values are distributed across the entire row specified by the expectedClass index.
|
|
|
Generates a TxtPad object holding a formatted confusion matrix in tabular form. All columns have the same width, which is that of the longest class name, so short class names are essential. In addition to the basic data, the table also specifies the totals number of predictions per class (bottom row), and the total number of ground-truth samples per class label, along with the percentage classified correctly, both overall, and per class (right hand side, in parentheses).
|
|
|
Clears the confusion matrix, removing any existing data.
|
|
||||||||||||
|
Provides direct access to the confusion matrix's raw data.
|
|
|
Accessor method.
|
|
|
Accessor method.
|
|
|
Accessor method.
|
|
|
Accessor method.
|
|
|
Accessor method.
|
|
|
Accessor method.
|
|
|
Generates a portable gray map (.pgm) version of the confusion matrix. This graphical form can be easier to read than the equivalent text-based table when there are many classes. It should be written to a file with the extension '.pgm'. The rows and columns are interpreted the same way as for the results of charPlot(), that is, predictions for the same class fall in the same column, whereas samples with the same ground truth label are placed in the same row. The darker a cell's shading, the larger the fraction of the samples of the particular class it represents. Perfect predictions thus consist of black cells on the diagonal of the matrix. |
 1.4.3
1.4.3